Boston, MA, June 21, 2022 -- Today, Emerson College Polling released the third installment of the research initiative: “Unlocking the Hispanic Vote,” in Florida. This project uses a combination of focus groups and surveys to better understand Hispanic attitudes and beliefs towards policy issues, politics, voting and media. The Florida study follows statewide studies of Hispanics in Colorado and Texas. Leer en español / Read in Spanish

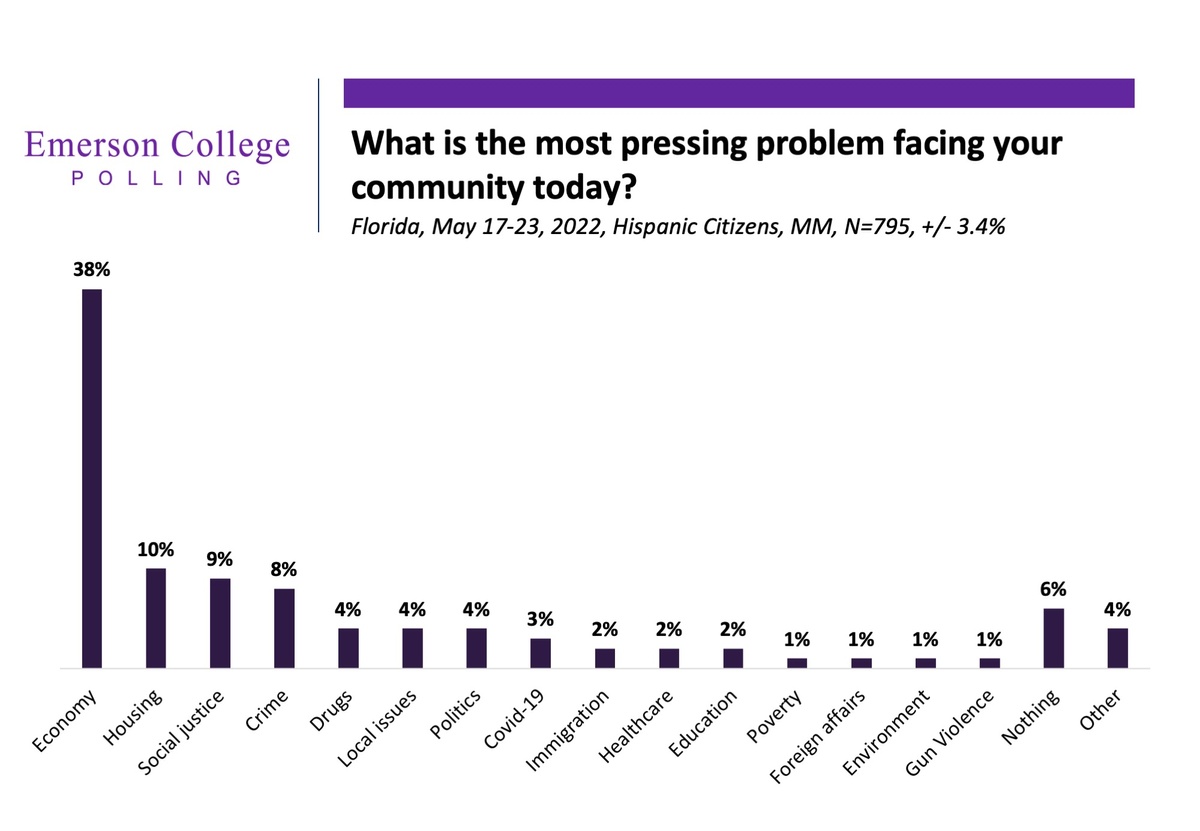
Nearly two in five Florida Hispanic residents, 38%, say the economy is the most pressing problem facing their community today. Across focus groups of voters and non-registered citizens, individuals categorize inflation and the rising cost of living as some of these economic factors, and say these issues are taking a significant toll on their personal and familial livelihoods.
A 19-year-old Nicaraguan woman said “it's getting harder and harder to live, and to live off the income that you're making, it's ridiculous…You go to a store and purchase certain things and you don't notice it, but they make packaging smaller, and you're paying a higher price.”
Several focus group members voiced concern over the economic toll on low-income individuals and young people. “It's like they are running the lower income people out of Florida. And they're lowering the middle class to a lower income,” a 44-year-old Republican male voter said.
Housing was a top issue for one in ten survey respondents. A 52-year-old Democratic Cuban voter said, “I've been here for 30 years. I tell my wife it's just getting so expensive, as they would say of New York and California, but we're up there with rent.”
Social justice issues, including racism and equality, were the most pressing matter for 9% of respondents overall, and this percentage rises to 24% among Hispanics between 18 and 24. On the topic of racism, focus group participants were asked where they see or experience racism the most. Some members said it is more prevalent online, on social media sites like Facebook.
Crime is a top issue for 8% of participants. Regionally, the issue was significantly higher in the Tampa-Clustion area (12%) and Orlando (14%) than it was reported in the North Florida (5%) and South Florida (6%) regions.
Politics: Democratic and Republican Party Positive to Plurality of Hispanics
The share of Florida Hispanics who view the Democratic and Republican Parties as very or somewhat positively are statistically even: 38% have a positive view of the Democratic Party and 38% have a positive view of the Republican Party. However, respondents are more neutral (36% to 33%) towards Democratic Party and more negative toward the Republican Party (30% to 26%) .
Hispanics in South Florida, the location of the focus groups, are nine points more favorable of the Republican Party than the Democratic Party: 46% have a positive view of the Republican Party compared to 37% who have a positive view of the Democratic Party.

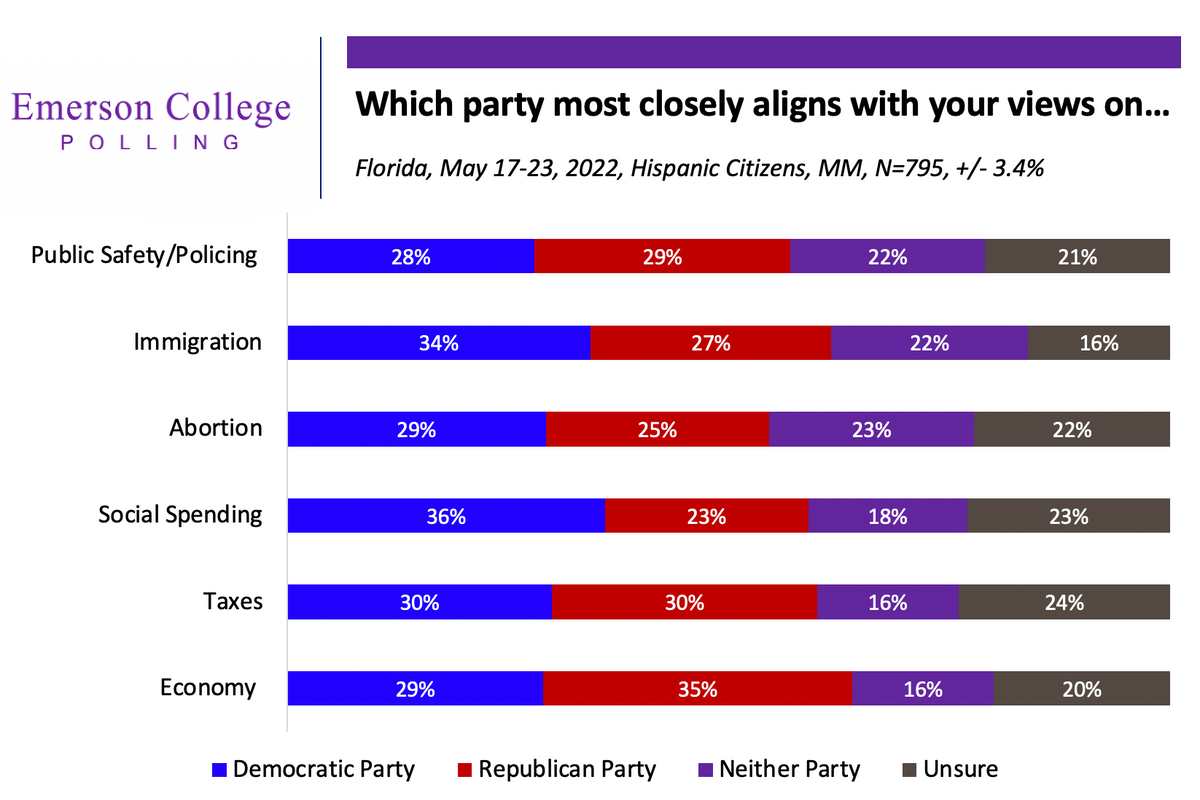
On the issue of the economy, 35% of Florida Hispanics say the Republican Party most closely aligns with their views, while 29% align with the Democratic Party. Conversely, 30% align with the Democratic Party and Republican Party respectively on the issue of taxes.
Across focus groups, former President Trump and the Republican Party were associated positively on the economy. A 19-year-old female non-registered citizen said, “I personally don't like Trump's character, but…we did have a good economy, with him as our president, you know?”
Distaste for Trump’s character exists across all three focus groups; however, his leadership is associated with a stronger economic state. “I think it may be a product of the way he ran the country, because he was running it as a business. It wasn’t as a politician, it was more for the benefit of us, of the citizens.” a 45-year-old Nicaraguan-born voter said. In another focus group, this sentiment was echoed, “Yes it wasn't perfect, it's never going to be perfect, but I think it was a lot better back then. I don't see any change with Biden.” a 51-year-old Republican Cuban female voter said.
On immigration, 34% of Florida Hispanics say they align with the Democratic Party, while 27% identify with the Republican Party. Registered voters are evenly split 35% to 35% on the issue. Focus group participants expressed frustration over identified lack of action on immigration by both parties. A 60-year-old Cuban Republican voter said, “And if you go back to Bush, Clinton, Obama, everyone of those guys said the same exact thing on immigration policy and there should be a right way to get in. Everyone. And what has changed? Nothing. So that's why I hate them both, that's my story.”
A 56-year-old Cuban non-registered citizen contrasted this sentiment, noting “the Cuban Adjustment Act was signed by a Democratic president. Lyndon Johnson, 1966. The Mariel Boatlift was in 1980? It was made possible by Carter, President Carter, another Democratic president. The wet foot policy? 1996, under President Clinton. So, on behalf of Cubans, I believe we Cubans should be very thankful of Democratic presidents.”
Among naturalized citizens in the focus groups, many emphasize supporting legal immigration practices, rather than engaging in discussions of amnesty. A 58-year old Cuban Independent female voter said: “I give a very simple example regarding immigration. In my house I let in whoever I think should enter. Whoever doesn’t, cannot enter. He cannot enter through the back door…My house is my house and you come to visit it, to stay and live there, but you have to respect my conditions, my laws that I have in my house.”
Voting and Civic Attitudes: Distrust in US Elections is High; Hispanic Voters Born Outside US Feel Sense of Duty to Vote
When asked what would get them to register to vote this November, a plurality (35%) of non-registered citizens said nothing. The remaining 65% said other factors could get them to register to vote, including different or better candidates (26%), if they were better informed (20%), and if they had time (16%).
“I think when I see better candidates I'll consider voting,” a 34-year-old Cuban non-registered citizen said. When pressed what that candidate might look like, they said “somebody who's not influenced by big companies and big money. Because a lot of these candidates … they do things just because somebody is backing them up with millions and millions of dollars … Governors, with senators, with mayors, everybody. And then Trump … well he's got his own money, so maybe he's making his own decisions. But, then he's kinda reckless.”
Among non-registered citizens, pluralities disagreed with the statements that their "vote won't change anything" (48%) and that "there's no difference between Democrats and Republicans" (45%).
There was significant distrust of the voting process among several non-registered citizens in the focus group in South Florida. “To me, [voting] all appears to be predetermined,” a 40-year old woman said. One participant asked fellow group members who thought the 2020 election was stolen from Trump. Other participants affirmed believing the election was rigged, and shared the sentiment that Trump actually won. A 52-year-old Venezuelan woman described the 2020 election as “an exact copy of what happened in Venezuela for 20 years.”
Regarding ballot initiatives, several voters across focus groups thought they were confusing, and sometimes deceiving. “Some of the questions sound like trick questions, you know? Like, if you wanna say, "Yes, I want this," but the way they word it, you have to put no… The questions are so long, they sound so complicated. Why can't they just make it simpler? On the ballot so you.. can say, "Yes"? You know, but sometimes it's like a trick question,” a 34-year-old Cuban man said.
Registered citizens were asked why they decided to vote in the last election. A plurality, 29%, said they voted because they have a duty as a citizen to vote. This sentiment is six points stronger among those born outside the US to voters born in the US: 32% of voters born outside the US say they vote because they have a duty as a citizen compared to 26% born in the US who say the same. Additionally, the share of individuals who say they voted in the last election to vote for their party’s candidate is 18 points higher among those born outside the US than those born in the US, 29% to 11%.
The duty to vote was expressed more explicitly in the Spanish-speaking focus group, where all members were born outside the US and became naturalized citizens. A 33-year-old Cuban-born Democratic woman said, “I felt like a citizen when I registered to vote. It's like a privilege, it's a decision you are making. Whether you win or not, it's a right, it's a right.” An independent female voter, born in Peru, said, “In Peru it is said that voting is a duty, not a right. One always has that mindset that it isn’t optional, that you have to contribute with your vote in such an important decision for the country. For me becoming a citizen was in my mind that it is a duty that I have to vote and contribute with my vote, good or bad.”
Media: Majority Turn to Cable and Network News; YouTube Is Top Social Platform
A majority, 53%, of respondents rely on cable or network news as their main source of information; 23% rely on social media, and 13% rely on local news.
Regionally, respondents in North Florida and the Orlando area were more likely to report using local news as their top source than those living in the Tampa area or those living in South Florida.
Focus group members expressed concern over bias on media platforms. “There's huge media bias. From the left and the right, if you wanna call it that. And no matter what you see, I like to look at different things to get different perspectives,” a 60-year-old Cuban Democratic voter said.
Youtube was the most popular social media platform at 21%, followed by Facebook and Instagram both at 18%; Twitter at 10%. The platforms differed between voters and non-registered citizens: registered voters were over three times as likely as non-registered citizens to report that they don't use social media for any of their news. Among registered voters, 17% of voters use Facebook, 16% YouTube, and 13% Instagram, compared to 28% of non-registered citizens who utilize YouTube, 24% Instagram, and 20% Facebook.
Focus group participants expressed some level of distrust regarding information on social media platforms, and some were mindful of the algorithms that bring information to their newsfeeds.
Survey Methodology
The survey of Hispanic citizens in Florida was conducted May 17-23, 2022. The overall sample consisted of Hispanic citizens in Florida, n=795, with a Credibility Interval (CI), similar to a poll’s margin of error (MOE) of +/- 3.4 percentage points. The registered voter sample consisted of registered voters in Colorado, n=468, with a Credibility Interval (CI) similar to a poll’s margin of error (MOE) of +/- 4.5 percentage points. The non-registered citizen sample consisted of non-registered citizens in Florida, n=327, +/- 5.4 percentage points. Data sets were weighted by region, gender, age, voter registration, and education. It is important to remember that subsets based on gender, age, and registration breakdown carry with them higher margins of error, as the sample size is reduced. Data was collected in Spanish and English using a cellphone sample using SMS-to-web, online panels, and an Interactive Voice Response (IVR) system of landlines.
Focus Group Methodology
Three focus groups of participants of Hispanic ethnicity were conducted in Miami, Florida in June 2022: one of Hispanic registered voters who vote (conducted in English), a second of Hispanic non-registered citizens (conducted in English), and a third of Hispanic registered voters who vote (conducted in Spanish). Recruitment was done by the focus group facility, AskMiami, and a recruiting service company, Portable Insights, Inc., was utilized for the non-registered citizens group. Both recruiters used the same participant screener. Participants were given a $125 incentive to take part in the study. The study has been approved by the Institutional Review Board (IRB) at Emerson College.
Note: Quotes from focus groups have been edited for brevity and clarity.
Full Survey Results and Focus Group Report & Transcripts are available to download.
###


