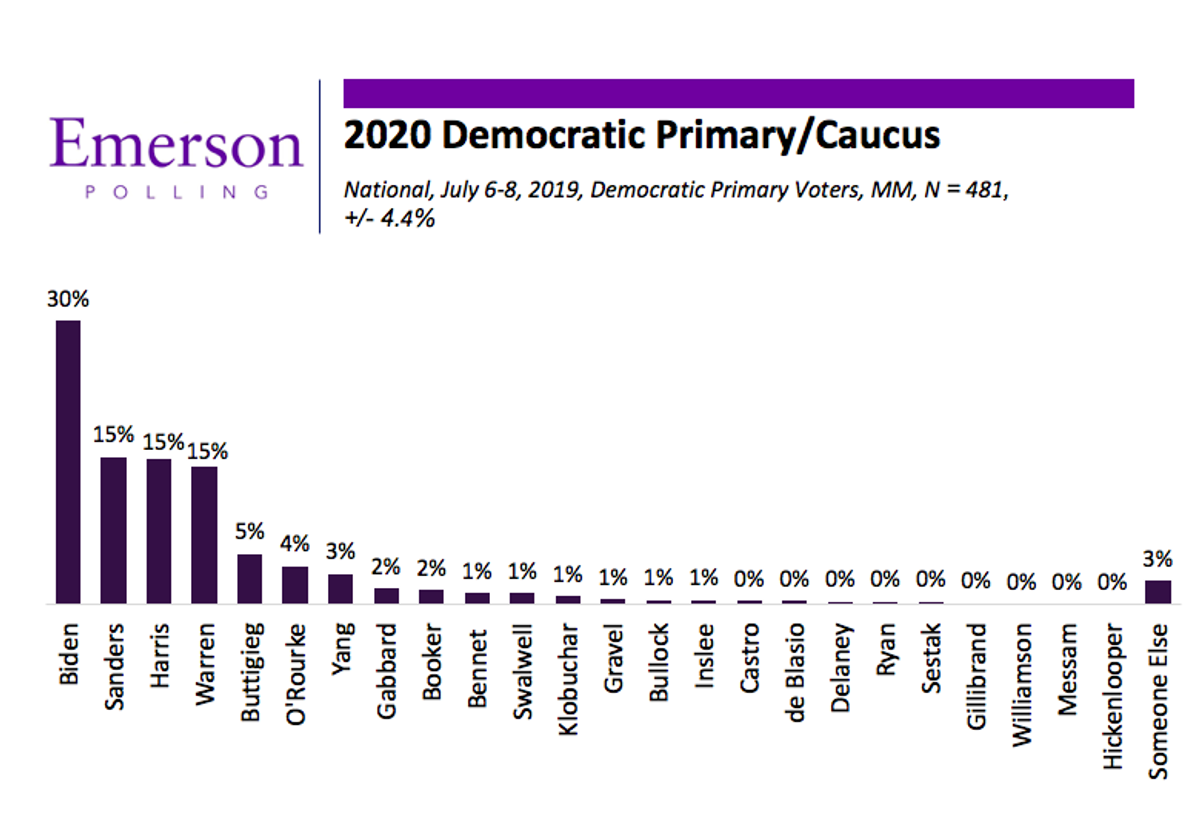
The first Democratic debate has shaken up the race for the Democratic nomination. Compared to June’s national poll, former Vice President Joe Biden extended his lead, Sen. Bernie Sanders lost ground, Sen. Kamala Harris doubled her support, and Sen. Elizabeth Warren held steady. Despite Biden losing 4 points of his support from 34% to 30%, he extended his lead in the Democratic primary from 7 points in June to 15 points, as his main rival, Sanders dropped 12 points to 15% from his June number of 27%. Harris saw her numbers improve 8 points to 15%, and Warren ticked up one point from June to 15% of the vote, creating a three-way tie for second. The data was collected July 6-8 and has a margin of error of +/- 4.4%.

Fifty-seven percent (57%) of voters said they followed the Democratic debates. A plurality of viewers, 30%, said Harris had the best debate performance. Eighteen percent (18%) of voters said Biden performed the best, 13% said Warren, and 10% chose Sanders. Conversely, when asked which candidate had the worst performance, 19% of voters said Biden, 15% said Sanders, and 13% said O’Rourke performed the worst.
Of those who watched all, some, or followed the media coverage of the debates, Biden receives 25% of the Democratic primary vote, but of those who did not watch/follow debates, he receives 39% of the vote. Conversely, Harris receives 18% of the vote among those who watched all, some or followed the debates, and 11% of the vote among those who did not. Spencer Kimball, Director of Emerson Polling, said “these numbers suggest that the Democratic field is still fluid and that Biden will need to improve upon his performance to maintain his lead”.
Forty-one percent (41%) of voters said they will definitely vote for their chosen candidate, but the majority, 60%, say they could still be persuaded by another candidate. Sanders and Biden continue to have the most loyal supporters as 55% of Sanders supporters will definitely vote for him and 51% of Biden supporters will definitely for him. Comparatively, 37% of Harris and 26% of Warren supporters have made a definitive choice of which candidate to support.
Biden leads among all age groups. This is a departure from previous Emerson polls, where Sanders has consistently lead among the youngest group of voters. Among 18-29 year olds, 26% support Biden, 24% support Sanders, and 10% support Warren. Among 30-49 year olds Biden leads with 23%, followed by Sanders with 19%, and Harris and Warren with 16%. With voters 50-64 year olds, Biden leads with 36%, followed by Harris with 22%, Warren with 15%, and Sanders with 8%. With those over the age of 65, Biden received 38%, followed by Warren with 19%, Harris with 14%, and Sanders with 8%.
President Trump’s approval has ticked up one point from the June national poll, with 44% approval and 48% disapproval. In June, the President’s approval was at 43% to 48% disapproval. Trump continues to hold a strong lead in the Republican primary with 91% of the vote against former Gov. Bill Weld at 9%.
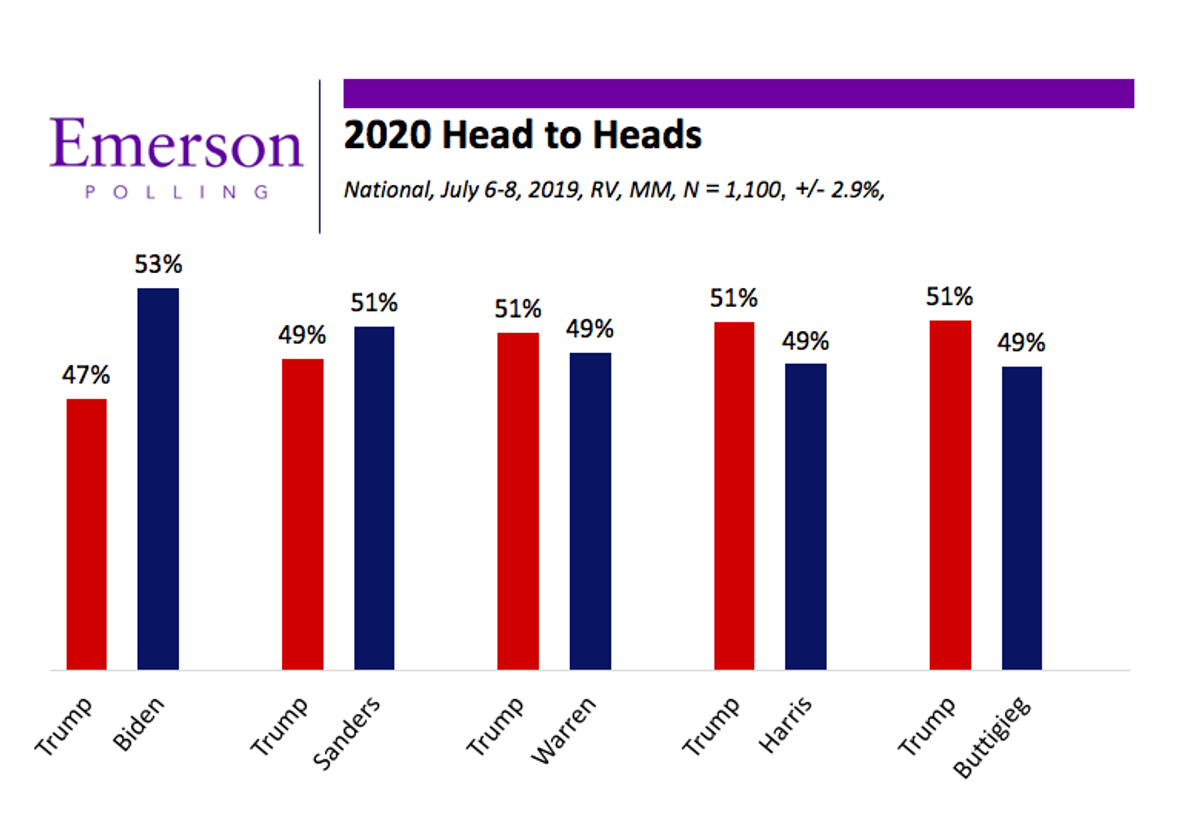
Since the June poll, Trump has seen his head to head numbers improve against all his Democratic rivals. He is now leading Warren, Buttigieg, and Harris 51%-49% each after trailing them all last month. Sanders leads Trump 51%-49% and Biden 53% to 47%. Kimball says, “It looks like Trump was a winner from the Democratic debate, as his head-to-heads tightened by about 5 points against all the leading Democratic candidates.”

The most important issue for voters in deciding their vote for President is the economy at 26%. Healthcare is the second most important issue for voters at 21%, followed by immigration at 17%, and social issues at 16%. There is a party divide however, as among Democratic primary voters, 29% chose healthcare as the most important issue, followed by social issues at 22% and the economy at 14%. With Republican primary voters, 42% chose the economy as the most important issue followed by immigration at 25%.
Caller ID
The national Emerson College poll was conducted July 6-8, 2019 under the Supervision of Professor Spencer Kimball. The sample consisted of registered voters, n=1,100, with a Credibility Interval (CI) similar to a poll’s margin of error (MOE) of +/- 2.9 percentage points. The data was weighted by age, region, income, and education based on 2016 turnout modeling. It is important to remember that subsets based on gender, age, party breakdown, ethnicity and region carry with them higher margins of error, as the sample size is reduced. Data was collected using both an Interactive Voice Response (IVR) system of landlines only (n=724) and an online panel provided by Amazon Turk (n=376).


